Welcome! We provide Programming Resources for Businesses.
We turn your ideas into software applications that increase business profits. Here are some of our best selling services.
Custom
Software
Applications
Web
Design and
Development
Data
Analysis
Services
Responsive
E-commerce
Solutions
Mobile
App
Development
Data
Backup
Solutions
Recent Blog Posts
Best server-side programming language
When it comes to developing server-side applications, there are only two serious contenders: PHP and Python. But which one of them is the best solution for business applications? We hope that this article will help you take an educated decision.
While PHP and Python are both high level programming languages, which have successfully stood the test of time, Python is older, being created in the late 80s. Python 3000 (3.0) was released in 2008, and it wasn’t backwards-compatible with the earlier versions. Fortunately, the active community has already ported many of the new Py3K features to the most up-to-date, and yet backwards-compatible Python version (2.7).
PHP was invented in 1994, and the latest major version (PHP 7) was released in 2015, with the main goal of optimizing performance. It looks like the code was heavily optimized indeed, being able to double the loading speed of the WordPress-based websites which were used as benchmarks.
As an initial conclusion, we can confidently say that both Python and PHP are old enough, so they are solid platforms which are going to be supported in the future as well. Let’s see what else separates these two elegant programming languages.
If you want to develop a web-based application, for example a SaaS platform, it is important to understand that Python wasn't created with web development in mind. Sure, it includes several useful libraries, but it isn't a full-stack development platform yet. On the other hand, PHP has been built with back-end web programming in mind from the very beginning, so it is the clear winner here. Therefore, if you want to have a web-based application developed, you should ask your coders to use PHP for it, and not Python.
What about tech support? Let’s search Google for “python forum” and “php forum”. The first search has revealed almost 60 million results, while the second one has delivered 715 million results. These figures may change significantly as Google discounts some of the results and adds new ones to its index, but I think that the conclusion is quite clear: most geeks use PHP for their projects, and this is another aspect that should be taken into account.
Python and PHP are both open source, and their code is quite easy to understand. They integrate with most of the top IDEs without any problems, which is a huge advantage for programmers who are used to working with Visual Studio, for example. Each one of them includes a detailed documentation.
However, there are several key differences that separate Python and PHP. For starters, Python is aspect-oriented, while PHP is object-oriented. This makes the PHP code more robust, while Python can be an attractive platform due to its flexibility.
PHP is similar with the C programming language, and this may be a positive aspect for C++, and even C# developers. However, due to the huge number of libraries, Python programmers can quickly create a large variety of applications that can help businesses which are active in pretty much any industry.
So, what is the best server-side programming language? By now you should have already figured out our answer: we can’t tell for sure. While Python is very flexible, PHP was built with the goal of powering servers in mind, and it does that perfectly. However, we can guarantee that both languages are powerful enough for most people's needs.
An introduction to data analysis
Data analysis is the process of analyzing, and then extracting useful information from data. The primary goal of data analysis is to discover actionable information that can be utilized to help businesses grow by increasing their productivity, helping their customers, and taking better decisions.
According to data-alliance.net, the industry has grown by about 5% per year over the last decade. It is not a surprise, considering the fact that data analysis involves understanding what happened in the past, what happens right now, and what steps needs to be taken to positively shape what will happen in the future.
The process begins by choosing the analysis objectives. The data researcher will begin by asking himself two important questions: what indicators will be used to evaluate performance, and what metrics need to change to help the business grow? Then, he will start to gather as much data as possible, using a great variety of sources. The gathered data needs to be cleaned using dedicated computer applications and human operators who will supervise the process. As you can guess, human operators are necessary because the data records may be incomplete, or they may contain errors. Often, the gathered data may include duplicate records as well.
It's time to focus on data modeling, drawing conclusions that can help managers take decisions. However, this step may require additional data cleaning, and even additional data sets. Each major decision should be followed by another data analysis process, which will validate it (or not).
Inferential statistics are used to determine the relationship between certain variables. As an example, a skilled data scientist can run an analysis that will help determine if there is any correlation between the amount of money that was allocated for advertising in a certain month, and the resulting company profits.
Here are the key factors that must be considered when it comes to data analysis.
Competence
Data scientists should be highly trained; otherwise, their data collection methods, analysis and conclusions will not be accurate. Always pick a company which employs researchers who have already demonstrated their expertise.
Effective data recording methods
Results can be greatly influenced by the chosen data collection methods. Often, analysts record audio data, and then use transcribing services to convert the information to text files. Surveys can be open ended, providing a greater flexibility, or closed ended, simplifying the researchers' job, but providing less value.
Data reliability
Most researchers utilize computers to evaluate how many people have answered "Yes" to a specific question. Still, this method may introduce errors if the transcribed data was also including similar answers, such as "Sure". It's just a very simple example, but it clearly demonstrates the importance of an underlying variable analysis.
Efficient data presentation
Raw data analysis results aren't always easy to understand, so they need to be turned into actionable information. A skilled data scientist should also have the ability to communicate its findings clearly, in an easy to understand form.
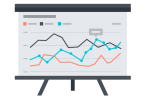
Often, companies require data in several formats, which can then be sent to the team of decision makers. Data researchers will frequently use tables to show the managers the relationship between specific numbers, while charts will provide a visual representation of the data variation.
Top five books for programmers
Stack Overflow is one of programmers’ favorite destinations, being visited by over 50 million people each month. It is estimated that over 20 million of them are professional developers; this makes it the world’s largest community, and a platform that can help people who want to learn programming, are interested in sharing their knowledge with others, or want to build their careers.
With so many active users, it’s not a surprise that the site can already boast with tens of millions of answered questions. Often, developers will also recommend helpful books, which can help beginners learn more about a particular programming aspect.
Fortunately, http://www.dev-books.com/ has analyzed over 40 million Stack Overflow answers, creating a list with the most recommended programming books. The list includes over 5,000 titles and can be of great help for people who are either trying to learn programming, or want to boost their coding skills.
Here are the top 10 most recommended programming books on dev-books.com
1. Working Effectively with Legacy Code by Michael C. Feathers
This book was written for programmers who want to learn how to safely test and debug complex projects. You will learn new techniques that can be used with any programming language; the author shows examples for Java, C, C++ and C#.
2. Design Patterns by Ralph Johnson, Erich Gamma, John Vlissides, Richard Helm
This book discusses the most common design-related problems, and shows elegant methods that help non-designers (read “programmers”) to solve them. It’s as if you’d look over the authors’ shoulders, learning from them how to properly create great looking, real-life applications.
3. Clean Code by Robert C. Martin
Bad code can work fine, but if your code isn’t clean, very few people will understand what it does. In fact, bad code may even get you fired! Robert Martin’s book wants to change that; the author is a software expert which uses this volume to present his advanced, agile-based code cleaning method.
Firstly, you will learn how to write clean code. Then, you will study several projects, which range from very simple to complex. Finally, you will get access to a knowledge base that will instantly help you spot bad code as you write it.
4. Java concurrency in practice by Brian Goetz, Tim Peierls
Java used to be a slow programming language in the past. Fortunately, things have changed for the better as the CPUs have become faster and faster, and Java 6’s concurrency features have increased application speed even more.
Java can now work with computers that utilize multiple processors, and this book will teach you everything you need to know to unleash their combined power. You will discover how to use the best concurrency building blocks, how to use threads safely, and much more.
5. Domain-driven Design by Eric Evans
This book can help any developer design an application which matches the mental model of the problem that it is supposed to solve.
Eric Evans focuses his energy on domain modeling in this book, and provides a great variety of techniques that can help developers build high quality business applications.
Want to learn more?
Then, read more of our blog articles! Learn more about our powerful data analysis methods, find out what is the best server-side programming language, discover the best books that can help understand the industry, and thus you pick a winning software development team, and more.